Category: Costs

  • Late Delivery Radar: The Global Refund Auditor

    Late Delivery Radar: The Global Refund Auditor

    PREREQUISITES:

    • Time: 5 mins
    • Access: Sidekick AI
    • Plan: Grow / Advanced / Plus

    The Hidden Carrier Debt

    Carrier guarantees are the most overlooked asset in ecommerce. If you pay for an expedited service and it arrives late, you are legally entitled to a 100% shipping refund. However, tracking these across different countries with varying carriers (USPS vs. Royal Mail vs. Canada Post) and different date formats is an operational nightmare. You’ve already paid for the speed—don’t let the carriers keep the change just because the data is messy.

    The Solution: Sidekick It

    The Late Delivery Radar is globally aware. Before it even starts auditing, it performs a “Localization Handshake.” By specifying your country, the app prepopulates the exact carriers, service levels (SLAs), and refund portal URLs relevant to your region. It even adjusts date formats so you aren’t confused by $MM/DD$ vs $DD/MM$ when filing claims.

    The Exact Prompt

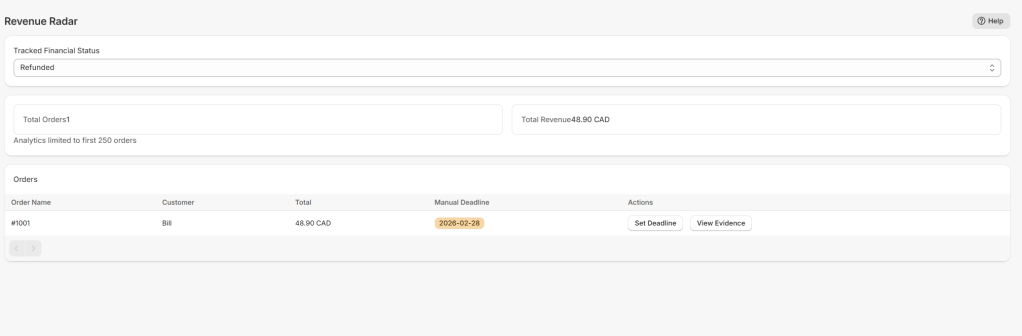
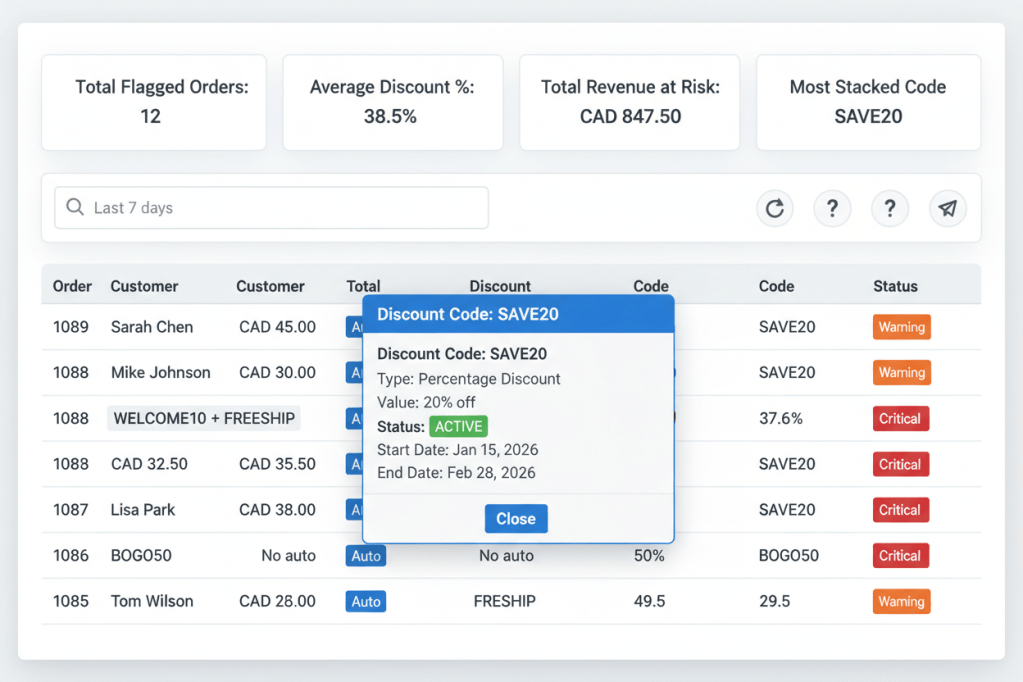
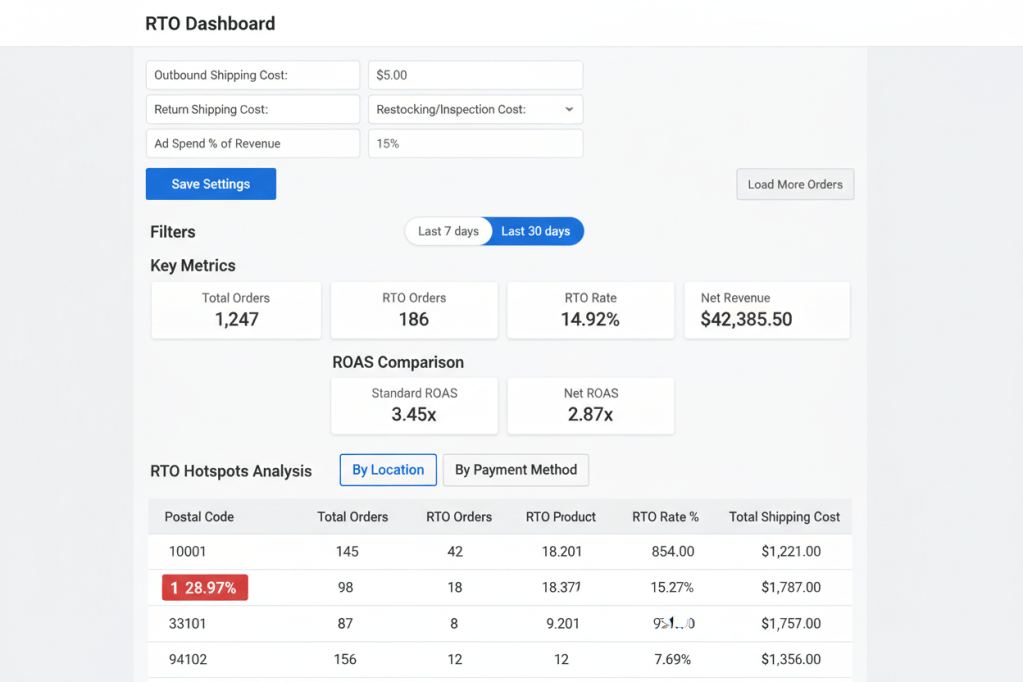
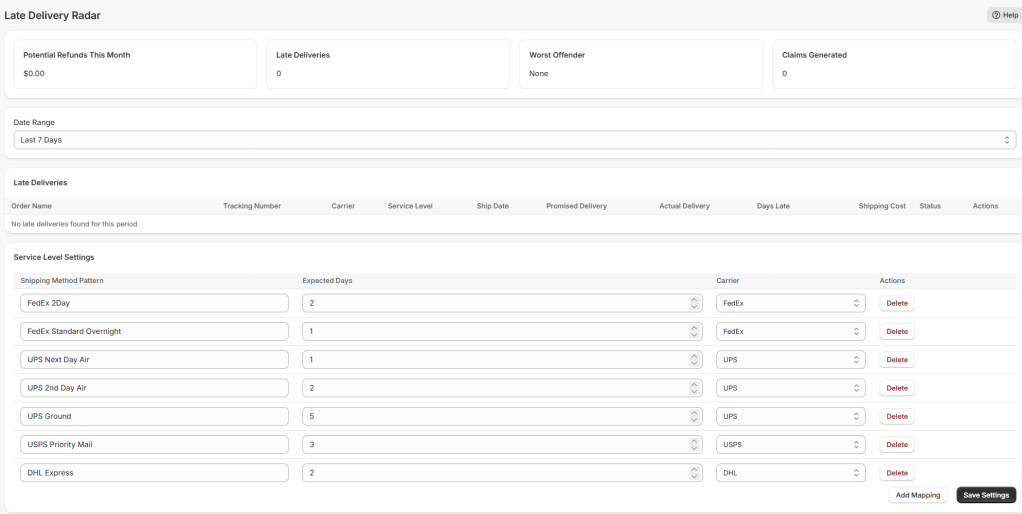
    IMPORTANT: Before building, ask me which country this store operates in (e.g., United States, Canada, United Kingdom, Australia, India, Germany, etc.).
    This is required because:
    Carrier names and service levels vary by country (e.g., USPS in US vs Royal Mail in UK).Date formats differ ($MM/DD/YYYY$ in US vs $DD/MM/YYYY$ internationally).
    Carrier refund policies and portal URLs are country-specific.
    Once I specify the country, build the "Late Delivery Radar" app with these features:
    1. LOCALIZED SLA SETTINGS:
    Pre-populate the mapping table with the top 3 carriers for that country.
    Store mappings (e.g., "Royal Mail Special Delivery" = 1 day) in a shop metafield (namespace: 'sidekick', key: 'shipping_slas').
    2. ANALYTICS DASHBOARD:
    Display Metric Cards for "Potential Refunds" (local currency), "Late Shipments," and "Worst Offender Carrier."
    3. SMART AUDIT TABLE:
    Columns: Order Name, Carrier, Service Level, Expected Delivery, Actual Delivery, and Status.
    Logic: Calculate delivery delta using Business Days specific to the region. Flag orders where delivered_at exceeds the SLA.Format:
    Use the country's standard date format in all table views.
    4. CLAIM GENERATOR:
    "Generate Claim" button opens a modal with a pre-formatted text block tailored to that country's carrier requirements.
    Provide direct "One-Click" links to the specific carrier refund portals (e.g., UPS.com/claims for US, or the Canada Post business portal).

    copy the above prompt to get started .


    The Logic Flow: Global Localization

    • The Handshake: Sidekick starts by asking where you are based. This is the “Master Switch” for the entire app logic.
    • SLA Pre-population: If you say “UK,” the app loads Royal Mail and DPD. If you say “US,” it loads FedEx and UPS.
    • Regional Calculation: The app adjusts its calendar logic for regional business days and formats dates correctly for your local carrier’s claim forms.
    • Evidence Assembly: When a late delivery is found, the app generates a claim package using the specific terminology and portal links for your country’s carriers.

    The Holiday Factor > Because the app is localized, it can better account for regional bank holidays that carriers use to “reset” their delivery clocks. This means fewer denied claims for you.

    Currency Match > Ensure your Shopify store currency matches the country you select in the app. The “Potential Refunds” card pulls from your total_shipping_price_set, so a mismatch in country selection could lead to confusing math.

    Common Questions

    Sidekick Challenge” question to encourage comments.

    What if I ship internationally?

    The app is best used for your primary shipping region. If you are a US store shipping to the UK, select “United States” to track the outbound carrier (like UPS or DHL Express) that you actually pay the bill to.

    Why does date format matter?

    Carriers are notorious for denying claims if a date is “ambiguous.” For example, by using DD/MM/YYYY for UK claims, we remove the carrier’s excuse to reject your refund.

    Can I add custom carriers?

    Yes! Even after the app prepopulates the big players, you can manually add local couriers in the Settings modal.

    The Sidekick Challenge: Run the Radar for your specific country today. Even if you only ship 20 expedited packages a week, carrier error rates hover around 5-10%. That’s “free money” just sitting in the carrier’s pocket!

  • Revenue Radar: Your Financial Command Center

    Revenue Radar: Your Financial Command Center

    PREREQUISITES:

    • Time: 5 minutes
    • Access: Sidekick AI
    • Plan: Grow / Advanced / Plus

    Master Your Money Trail

    Revenue leakage often happens in the “gray areas” of Shopify—orders that are authorized but not captured, pending payments that never clear, or disputes that go unanswered because a deadline was buried in an inbox. Most merchants lack a single, bird’s-eye view of these critical financial states.

    The Solution: Sidekick It

    Revenue Radar is a high-performance monitoring tool that bridges the gap between your order list and your bank account. It doesn’t just track disputes; it allows you to toggle between 8 different financial statuses, set manual urgency deadlines, and generate “Evidence Packages” that you can download as files or copy to your clipboard for instant dispute resolution.


    The Exact Prompt

    Create a Shopify admin app called 'Revenue Radar' that tracks and manages orders by financial status with deadline tracking and evidence collection.
    1. STATUS SELECTOR & ANALYTICS:
    - Dropdown with 7 financial statuses: Pending (default), Authorized, Partially Paid, Paid, Partially Refunded, Refunded, Voided
    - Auto-save selection to sidekick.chargeback_settings metafield and auto-refresh dashboard
    - Display 'Total Orders' and 'Total Revenue' metric cards for selected status (first 250 orders)
    - Show 'Showing first 250 orders' note when limit reached
    2. DYNAMIC ORDERS TABLE:
    - Columns: Clickable Order Name (opens shopify://admin/orders/{id} in new tab), Customer, Total, Manual Deadline (badge), Actions
    - Deadline badges: Red/Critical if ≤48h, Yellow/Warning if ≤7 days, show 'Overdue' if past
    - Actions: 'Set Deadline' (opens date picker modal) and 'View Evidence' (opens evidence modal)
    - Cursor-based pagination with 25 orders per page
    3. DEADLINE CALCULATION WITH TIMEZONE FIX:
    - Parse deadline date as end of day (23:59:59) in user's local timezone using: new Date(deadline + 'T23:59:59')
    - Calculate hours remaining from current time to end of deadline day
    - Display as hours if ≤48h or days if ≤7 days
    - This ensures "tomorrow" means the full day tomorrow in the user's timezone, not midnight UTC
    4. EVIDENCE MODAL WITH RISK DATA:
    - Query order details including: customer info, fulfillments (tracking numbers/URLs), risks (level, message), lineItems
    - Display formatted Evidence Package in read-only text area (15 rows) with sections: Order Info, Customer Details, Risk Assessment, Fulfillment Info, Line Items, Total
    - Download button with icon exports as 'Evidence-{OrderName}.txt'
    - IMPORTANT: Only query risks when 'View Evidence' is clicked (not on page load or installation)
    - Clear evidenceText state when modal closes via onHide handler
    5. MODALS & STATE MANAGEMENT:
    - All modal close buttons use onClick={() => modalRef.current?.hideOverlay()} (NOT commandFor/command)
    - Evidence modal has onHide={handleEvidenceModalClose} to clear state
    - Help modal with 5-step usage guide and limitations
    6. TECHNICAL SPECS:
    - Store deadlines in sidekick.dispute_deadlines metafield (JSON mapping order IDs to dates)
    - Store settings in sidekick.chargeback_settings metafield
    - Use shop.id as ownerId for metafields
    - Use s-date-picker (type='single'), s-text-area (readOnly), s-spinner for loading states

    copy the text above for your Sidekick prompt


    The Logic Flow: From Alert to Action

    • Monitor: Select “Disputed” or “Authorized” from the top dropdown to instantly see where your capital is tied up.
    • Track: When you identify a dispute, use the “Set Deadline” button. The Radar will now visually flag that order as it gets closer to the bank’s cutoff.
    • Prepare: Click “View Evidence.” The app automatically pulls the tracking URL, delivery timestamp, fraud risk analysis, and line item details.
    • Resolve: Copy the pre-formatted text for a quick reply, or Download the .txt file to keep as a permanent record for your accounting or legal team.

    The Click-Through Advantage
    The order names in the table are live links. If you see a high-risk “Disputed” order, click it to jump straight into the native Shopify Order page to verify customer notes before submitting your evidence.

    The 250 Limit
    To keep the app lightning-fast, analytics are calculated based on the first 250 orders. If you are a high-volume store with more than 250 active disputes (ouch!), use the paginated table to work through the list.

    Common Questions

    How do I download the evidence?

    Inside the “View Evidence” modal, there is a dedicated download button. It creates a .txt file on the fly, which is perfect for uploading as an attachment to support tickets.

    Can I change the status names?

    The app uses Shopify’s native financial statuses to ensure data accuracy, but you can use the Help modal to understand exactly what each status represents.

    Where is the data stored?

    All your settings and deadlines are stored in your store’s Metafields. This means the data is yours and stays with your store even if you reset the app.

    The Sidekick Challenge: Switch your Revenue Radar to “Authorized.” Look for any orders older than 3 days. If the payment hasn’t been captured, you might be at risk of the authorization expiring. Capture those funds today!

  • Smart Discount Protector: Stop Your Profit Margins from Eroding

    Smart Discount Protector: Stop Your Profit Margins from Eroding

    PREREQUISITES:

    • Time: 60s
    • Access: Sidekick AI
    • Plan: Grow / Advanced / Plus

    The “Discount Stacking” Trap

    It starts with a simple “Welcome” code. Then you launch a “Buy One Get One” automatic discount for a holiday. Before you know it, a customer has used both, stacked a “Free Shipping” code on top, and you’ve just sold a product for less than it cost you to manufacture. Discount stacking is a silent margin killer. If you aren’t monitoring how your discounts collide, you aren’t just giving away profit—you’re paying customers to take your inventory.

    The Solution: Sidekick It

    To “Sidekick It” is to stop guessing and start auditing. Today, we’re building the Smart Discount Protector (aka the Discount Stacking Shield). This app provides a real-time command center that flags every order where total discounts exceed your safe thresholds. By identifying the “Most Stacked Codes” and calculating “Revenue at Risk,” you can fix your discount logic before the next big sale.

    PREREQUISITES

    • Shopify Plan: Must be on a plan with Sidekick access (Grow or higher).
    • Threshold Knowledge: Determine your “Warning” (e.g., 30%) and “Critical” (e.g., 40%) discount limits based on your COGS.
    • Sidekick Access: Ensure the Sidekick icon is active in your admin sidebar.

    The Exact Prompt

    Build a custom Shopify admin app called "Smart Discount Protector" (subtitle: "Discount Stacking Shield") that monitors and flags orders with excessive discount stacking.
    Main Dashboard: > - Show 4 analytics cards: Total flagged orders, Average discount %, Total revenue at risk, and Most stacked discount code.
    Display a table of flagged orders including: Order number (clickable link), Customer, Total, Discount Amount, Discount %, and Status badge (Warning/Critical).
    Include "Search" and "Time Filters" (24h, 7d, 30d).
    Logic & Storage: > - Calculate Discount % as: (total discount / (current total + total discount)) × 100.
    Flag orders above configurable thresholds (Default: 30% Warning / 40% Critical).
    Store thresholds in shop metafields (namespace: 'sidekick', key: 'discount_protector_settings').
    Automatically filter out refunded/cancelled orders to prevent false positives.
    Features: > - Clickable discount codes that open a modal with full details (type, value, start/end dates).
    Color-coded badges: Orange (Warning), Red (Critical), Blue (Automatic Discount indicator).
    Pagination and Refresh functionality.

    Highlight the text in the box above and copy it to your clipboard to start your build.

    How the Shield Protects You

    • Continuous Monitoring: The app scans your completed orders across the selected time period.
    • Stacking Detection: It doesn’t just look at one code; it sums up Manual Codes + Automatic Discounts to find the true discount percentage.
    • Visual Alerting: Orders are instantly color-coded. A “Red” status means the order likely hit your profit floor.
    • Actionable Data: By clicking on a flagged code, you can see if that specific promotion is the culprit, allowing you to disable or modify the rule in Shopify immediately.

    Technical Note: Post-Purchase Analysis
    This app is a monitoring tool, not a checkout blocker. Because Shopify’s checkout is highly secure, this app analyzes orders after they are placed. Use the data gathered here to adjust your “Discount Combination” settings in the Shopify Admin to prevent future stacking.

    Caution: Set Your Floor
    “Critical” thresholds should represent your “Breakeven” point. If your average margin is 45%, a 40% discount is critical because after credit card fees and shipping, you are likely losing money.

    Common Questions from the Lab

    Does this stop the customer from checking out?

    No. It identifies problematic orders once they are completed. If an order is truly disastrous, you can use the clickable order link to jump into the admin and cancel/refund it before fulfillment.

    Why does it ignore refunded orders?

    Refunded orders often show “100% discount” in data exports because the revenue is zeroed out. The app filters these out so your analytics remain accurate to actual sales.

    What is “Revenue at Risk”?

    This is the total dollar amount you have “lost” to discounts on flagged orders. It helps you quantify exactly how much stacking is costing your business each month.

    The Sidekick Challenge: Run this app for the “Last 30 Days.” What is your Most Stacked Code? If it’s a “Welcome” code stacking with your main sale, it might be time to update your discount combination settings!

  • Stop the Profit Leak: Build a Shopify RTO & Profitability Dashboard

    Stop the Profit Leak: Build a Shopify RTO & Profitability Dashboard

    PREREQUISITES:

    • Time: 90s
    • Access: Sidekick AI
    • Plan: Grow / Advanced / Plus

    The “RTO” Profit Killer

    Have you ever celebrated a high-revenue day, only to realize a week later that 20% of those orders were Returned to Origin (RTO)? For merchants—especially those offering Cash on Delivery (COD)—a sale isn’t a sale until the package is delivered. Between double shipping fees, restocking labor, and burnt ad spend, RTO can turn a “profitable” campaign into a massive loss. If you aren’t tracking your Net ROAS, you’re flying blind.

    The Solution: Sidekick It

    Today, we’re using Shopify Sidekick to build a custom RTO Dashboard. This app creates a central command center to identify your “Hotspots”—the specific products, zip codes, and payment methods costing you money. By correlating your returns with actual shipping costs, you can finally see your true profitability without exporting a single spreadsheet.

    The Exact Prompt

    Create a brand new app called "RTO Dashboard" to track Return to Origin rates and true profitability.
    The app should:
    Display a Main Metrics bar: Total RTO %, Total Orders, Net Revenue, and a side-by-side comparison of Standard ROAS vs. Net ROAS.
    Include a Hotspot Analysis section with three tabs:
    "By Location": Table showing postal codes, RTO rates, and total shipping costs. Highlight zones >20% RTO in red.
    "By Product": Table showing SKUs with RTO rates and net profit per SKU. Flag items >30% RTO.
    "By Payment Method": Compare COD vs. Prepaid RTO rates and Average Order Value.
    Logic:
    Use orders tagged with "RTO" to identify failed deliveries.
    Allow user to input default costs: Outbound Shipping, Return Shipping, and Restocking fees.
    Calculate Net ROAS: (Revenue - Returns - Reverse Logistics Costs) / Ad Spend.
    Include Date Range filters (7, 30, 90 days).
    Keep the UI clean using Shopify Polaris components.

    Highlight the prompt above and copy it to your clipboard to start your Sidekick build.

    Key Features of Your New App

    • True Profit Metrics: Automatically calculates Net ROAS, accounting for shipping losses and restocking fees.
    • Hotspot Identification: Instantly isolate high-risk zip codes to optimize your shipping zones or COD availability.
    • Product Quality Audit: Spot “problem children” in your catalog that look like bestsellers but have unsustainable return rates.
    • Payment Comparison: Hard data to help you decide if the volume from COD is worth the cost of the returns.

    Technical Note: This app relies on the order tag “RTO”. To automate this, set up a Shopify Flow trigger: When Fulfillment Event Created -> If Status is “Returned to Sender” -> Add Order Tag: RTO. This ensures your dashboard stays updated in real-time

    Caution: Reverse logistics costs (the return trip) are often higher than outbound costs. Ensure you update your “Cost Settings” in the app regularly to reflect current carrier surcharges for accurate reporting.

    TIP: Review the post Monitor Shopify Flow Status with Heartbeat to keep an eye on your RTO tagging

    Common Questions

    Does this app actually process the refunds for me?.

    No. This is an Analytics Dashboard. It identifies where you are losing money so you can make better strategic decisions. Refunds are still handled through the standard Shopify “Orders” screen

    Can I track RTO for specific marketing channels?

    Yes! By inputting your ad spend for a specific period into the app settings, the dashboard will calculate your Net ROAS against your total order volume for that timeframe.

    Is this only useful for COD stores?

    Not at all. Even if you don’t offer COD, this tool is vital for identifying “serial returners” or products with sizing/quality issues that are hurting your bottom line.

    The Sidekick Challenge: Look at your “By Location” tab. Are there specific zip codes where your RTO is over 25%? Let us know in the comments if you’ve decided to “blacklist” certain zones to save your margins!